
Torsional/Axial Frequency Analysis Results
Interference Diagram (Campbell Diagram)
This plot displays the Frequency Interference Diagram. It is commonly called Campbell diagram. Up to 5 excitation lines can be displayed and each excitation slope is separated by a comma in the Excitation Slopes data entry. For example, the Excitation Slopes for the following display is set to be 1, 2. Since this is a synchronous motor driven train, twice the slip frequency is also shown in the figure. You can change the graph title, labels, scale, number of divisions and many others by changing the default settings in the Setting dialog under Options menu.
Note: for torsional analysis, the outputs can be referenced to the actual or equivalent system. For details on this conversion, click Torsional Vibration Analysis.
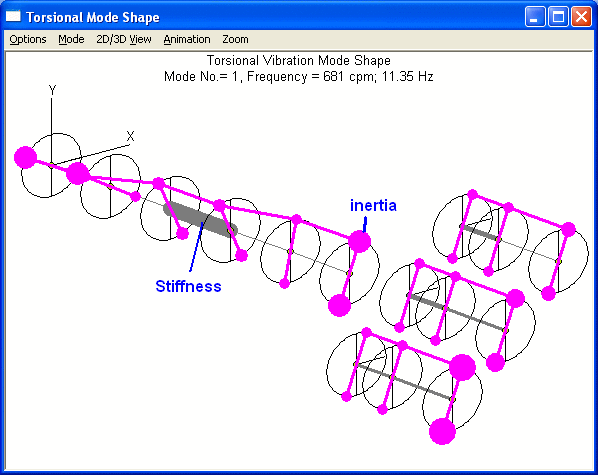
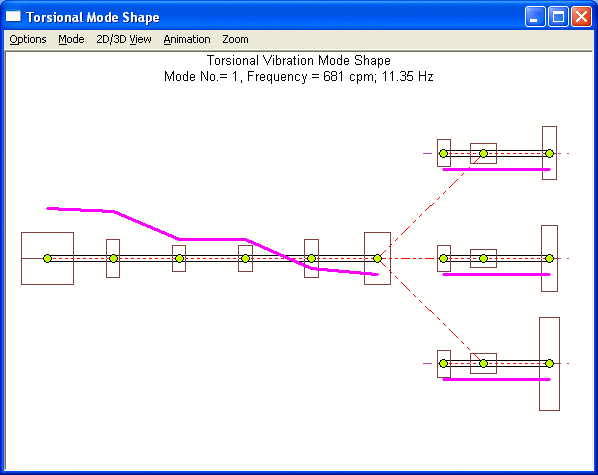
Torsional/Axial Mode Shapes
This option displays the torsional or axial vibration mode shape. You can change the graph title, labels, scale, and many others by changing the default settings in the Setting dialog under Options menu. Animation option allows you to animate the motion.
The mode shape can be displayed in a 2D or 3D format. For a torsional 3D mode shape plot, the relative size of the inertia and stiffness are also shown in the plot
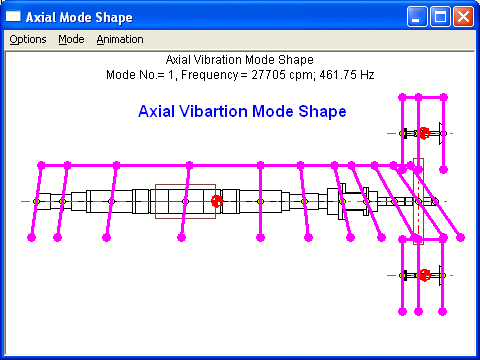
Axial vibration mode shape
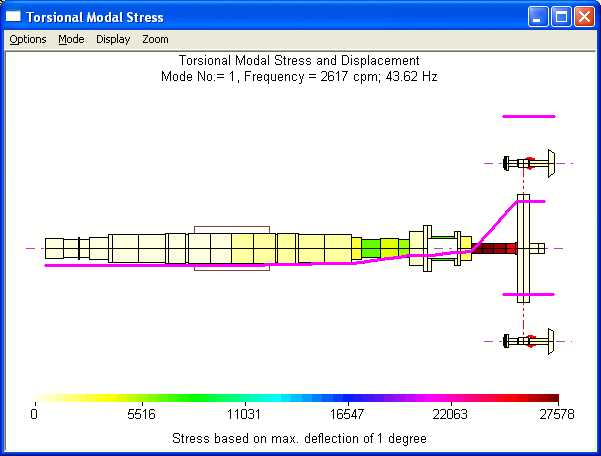
Torsional Modal Stress
Modal stress based on 1 degree of maximum deflection is shown below:
See also Torsional Vibration Analysis, Torsional Damped and Undamped Natural Frequencies and Modes Calculation, Axial Damped and Undamped Natural Frequencies and Modes Calculation.
Copyright © 2014-2017