For the time transient analysis, it can be performed at a constant speed or at various speed during startup or shutdown. Again, Animation feature plays an important role in visualization of the rotor motion.
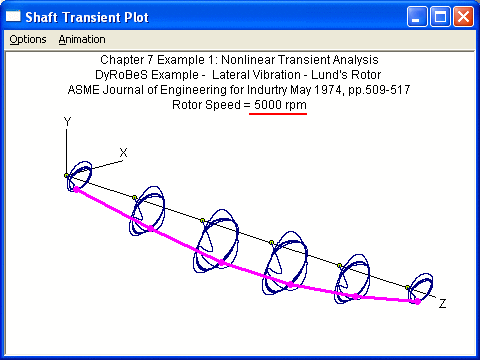
The shaft response at a constant speed is shown below:
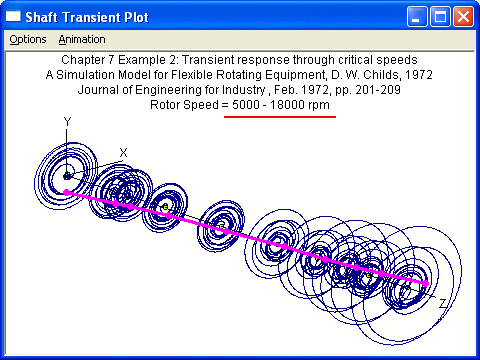
The shaft response during startup is shown below:
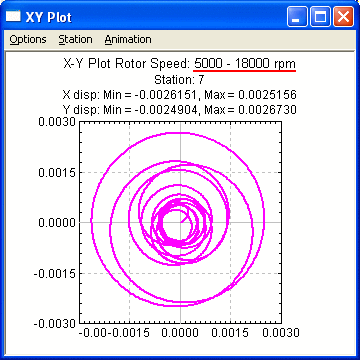
Time Transient X-Y Plot
This plot displays the time transient orbit displacement. This option is useful in the investigation of the initial response of a rotor to a sudden excitation and also for the investigation of nonlinear effects such as caused by nonlinear bearings.
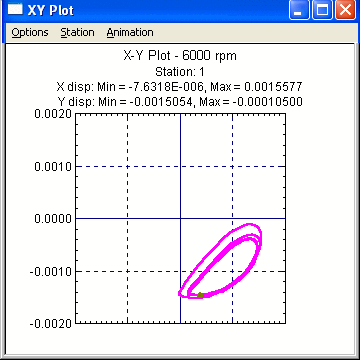
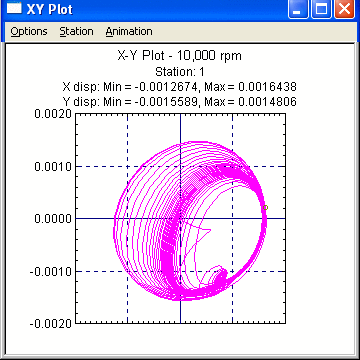
The following figure is a X-Y displacement plot for a fluid film bearing with unbalance and gravity effects. At 6000 rpm, the rotor is stable with a nearly elliptical orbit. At 10,000 rpm, the rotor just passes the instability threshold and the orbit is growing with time. The motion will eventually approach the limit cycle motion.
At 6000 rpm
At 10000 rpm
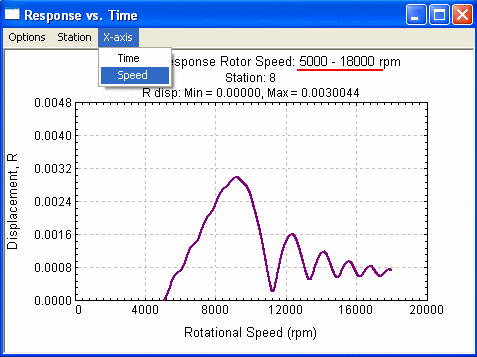
Following picture shows the rotor motion from 5000 rpm to 18000 rpm.
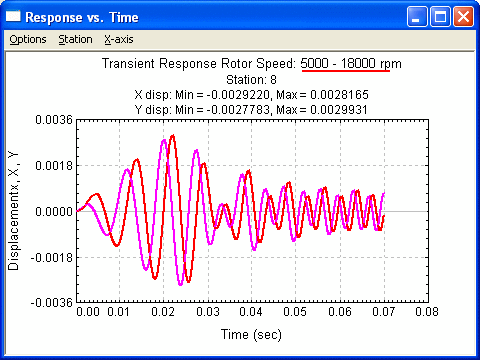
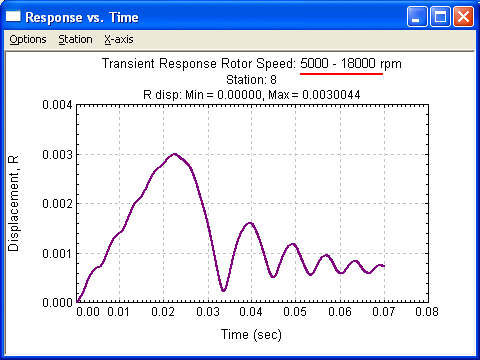
Transient Response vs. Time (Speed)
This plot displays the transient response vs. time. In the setting, you can display X displacement, Y displacement, and/or radial displacement. You can change the graph title, labels, scale, number of divisions and many others by changing the default settings in the Setting dialog under Options menu. For startup/shutdown, the X-axis can be either time or speed. However, at constant speed transient analysis, the X-axis can only be the time.
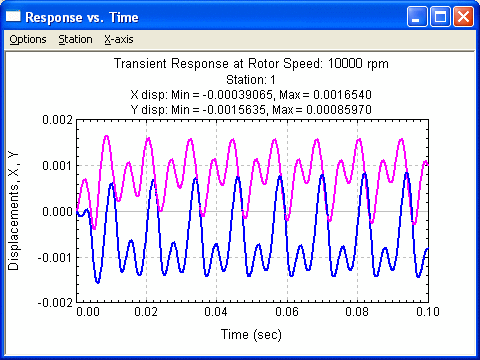
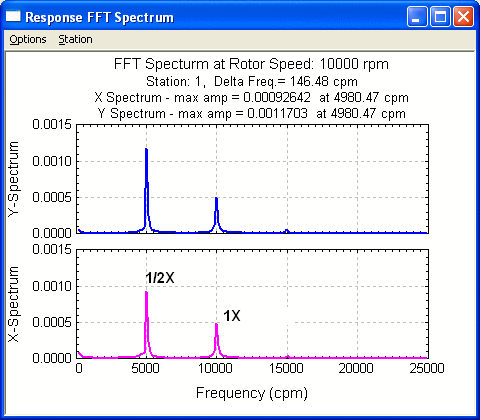
Following is a sample plot at 10,000 rpm where the sub-synchronous vibration component is higher than the synchronous vibration component.
Followings are results for startup/shutdown transient analysis.
X, Y displacements vs. time
R displacement vs. time
R displacement vs. speed
FFT Spectrum
This plot displays the transient response in spectrum format. You can change the graph title, labels, scale, number of divisions and many others by changing the default settings in the Setting dialog under Options menu. In the default setting, the zero harmonic component (DC level) is not shown in the plot. To include the zero harmonic component, simply check the box in front of the DC Level. This option is available only at constant speed transient analysis.
The following figure shows a rotor with a subsynchronous vibration component. The rotor is operated at 10,000 rpm, the subsynchronous vibration (4980 rpm) is larger than the synchronous vibration. This indicates that the rotor is operated at the unstable condition.
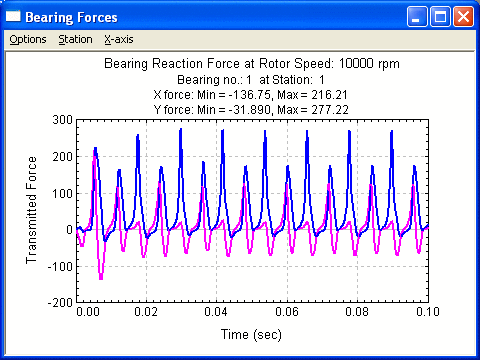
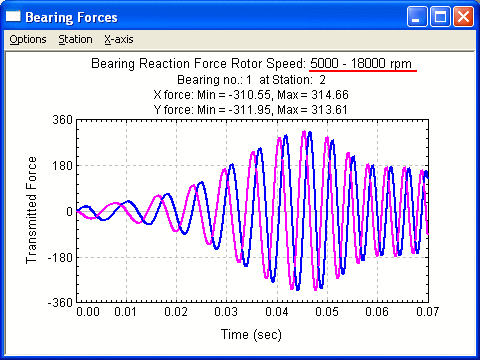
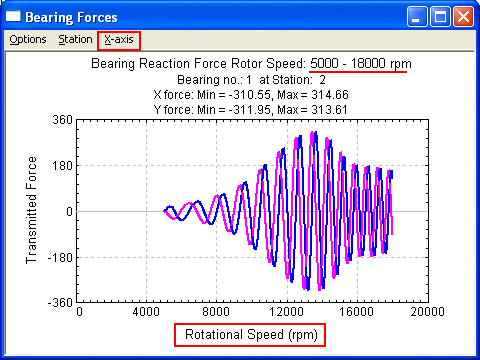
Transient Bearing Reaction Forces
This plot displays the transient bearing reaction forces in X direction, Y direction and/or radial amplitude vs. time (or speed if startup/shutdown analysis is performed). You can change the graph title, labels, scale, number of divisions and many others by changing the default settings in the Setting dialog under Options menu.
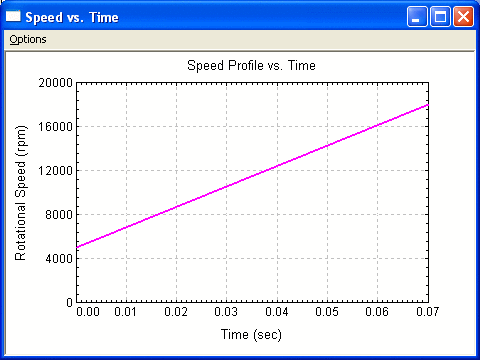
Transient Speed vs. Time
This plot displays the speed vs. time for startup/shutdown. This is used for verification purpose to double-check the speed input.
See also Lateral Vibration Analysis, Time Transient Analysis.
Copyright © 2014-2017