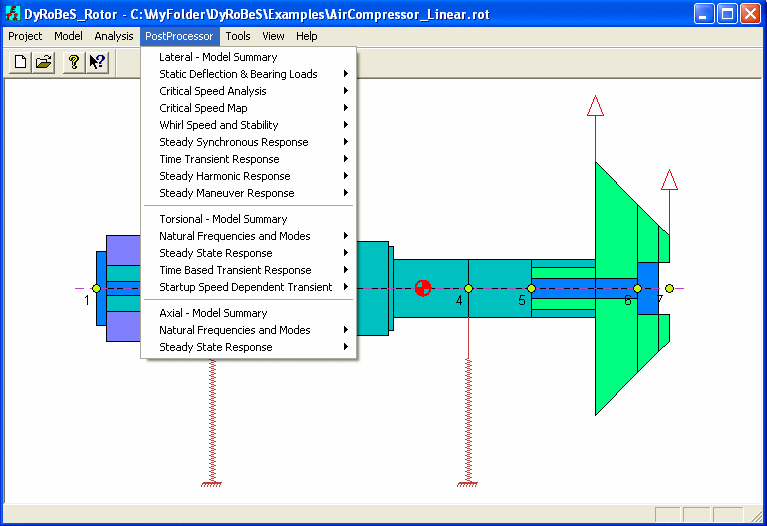
The assessment of the analysis results constitutes an important aspect of the entire simulation process. The PostProcessor allows you to view the results in the ASCII (text) format and/or the graphics format. DyRoBeS©_Rotor provides a large number of post processing tools for graphically displaying the results. You can open the Child Windows (PostProcessor graphics) as many as you like to help you to interpret and understand the analysis results. When you open a post processing Child Window, some default initial settings are used to display the results. To modify these settings, select the Settings under the Options to make necessary changes. Whenever possible, Scale Factor is introduced in the Settings. This scale factor allows you to change their Y axis data scale, such as changing units from inches to mils or to mm, from mm to inches, etc. A new feature Export Data has been also implemented in Version 6.0, this option allows you to export the graphic data into an ASCII text file so you can plot this data using other graphic software. You are strongly recommended to try the graphic Settings under the Options menu to see their effects and to resize the Child Window to redraw (update) the picture. Animation can be an excellent tool to understand the rotor behavior. Whenever possible, animation is provided in the postprocessor.
For better understanding the analysis results, please refer to the book by Chen and Gunter (2005).
The following is a list of the post processing graphic features:
Critical Speed Energy Distribution
Responses at Multiple Stations
Displacement Orbit at Single Station
Bearing/Support Transmitted Forces
Element Shear Forces and Moments
Transient Response vs. Time (or Speed)
Torsional Frequency Interference Diagram
Torsional Steady State Response
Torsional Steady State Element Vibratory Torque
Torsional Steady State Element Vibratory Stress
Torsional Steady State Excitations
Torsional Transient Response (Time Dependent Excitations)
Torsional Transient Response - Displacement
Torsional Transient Response - Velocity
Torsional Transient Element Deflection
Torsional Transient Element Deflection
Torsional Transient Element Vibratory Torque
Torsional Transient Element Vibratory Stress
Torsional Transient Applied Torques
Torsional Transient Response FFT Analysis
Torsional Transient Response (Speed Dependent Excitations)
Torsional Startup Speed vs. Time
Torsional Startup Transient Element Deflection
Torsional Startup Transient Element Vibratory Torque
Torsional Startup Transient Element Vibratory Stress
Torsional Startup Driving and Load Torques
Axial Frequency Interference Diagram
Axial Steady State Element Vibratory Force
Axial Steady State Excitations
The following figure shows the various options for post processing.
The line Control Data allows you to change the line thickness and color. The plotted curves on a laser printer or ink jet printer will not be as thick as the lines shown on the computer screen. Therefore, if a hardcopy from printers is needed, the line thickness should be increased. The lines may appear too thick on the computer screen, but it will result in a more satisfactory graphical printout. See Graphic Preferences Settings under Project.
Copyright © 2014-2017